📊 Expand Engine Config
  Qwen3.8-Flash-Next-UD-Q4_K_XL:
    ttl: 3000
    cmd: >
      /usr/local/bin/llama-server
      --port ${PORT}
      --model /models/qwen3.8-flash-next/UD-Q4_K_XL/Qwen3.8-Flash-Next-UD-Q4_K_XL-00001-of-00004.gguf
      --mmproj /models/qwen3.8-flash-next/mmproj-BF16.gguf
      --model-draft /models/qwen3.8-flash-next/mtp-Qwen3.8-Flash-Next-Q8_0.gguf
      --spec-type draft-mtp
      --spec-draft-n-max 3
      --ctx-size 262144
      --flash-attn on
      --cache-type-k q8_0
      --cache-type-v q8_0
      --ubatch-size 2048
      --main-gpu 0
      --split-mode none
      --parallel 2
      --temp 1.0 --top-p 0.95 --top-k 20 --min-p 0.0
  qwen3.8-flash-next-ninfer6000:
    ttl: 10000
    healthCheckTimeout: 900
    useModelName: Qwen/Qwen3.8-Flash-Next
    cmd: >
      /ninfer6000/build/apps/ninfer-serve /models/qwen3.8-flash-next/ninfer-conv/swift_1_5_qwen3_8_flash_next_nvfp4_fp8ple_fp8proj.ninfer
      --port ${PORT}
      --model-id Qwen/Qwen3.8-Flash-Next
      --max-context 262144
      --kv-capacity auto
      --kv-dtype bf16
      --max-concurrency 2
      --pending-timeout-ms 600000
      --device-state-slots 2
      --host-state-slots 8
      --host-kv-mib 16384
      --spec mtp
      --draft-tokens 3
      --lm-head-draft
      --vision
      --preserve-thinking
      --prefill-chunk 8192
  qwen3.8-flash-next-nvfp4:
    ttl: 10000
    healthCheckTimeout: 900
    env:
      - CUDA_VISIBLE_DEVICES=0
      - VLLM_PLE_CPU_OFFLOAD=1
      - MAX_JOBS=3
    cmd: >
      vllm serve /models/qwen3.8-flash-next/nvfp4
      --served-model-name qwen3.8-flash-next-nvfp4
      --port ${PORT}
      --quantization modelopt
      --trust-remote-code
      --max-model-len 262144
      --max-num-seqs 2
      --max-num-batched-tokens 8192
      --gpu-memory-utilization 0.95
      --enable-prefix-caching
      --async-scheduling
      --no-enable-flashinfer-autotune
      --reasoning-parser qwen3
      --enable-auto-tool-choice
      --tool-call-parser qwen3_coder
      --speculative-config '{"method":"mtp","num_speculative_tokens":2}'

Intro
It is abundantly clear we’ve entered the age of hyper-specific inference engines tuned to a specific model and specific hardware. I was scrolling Reddit when I came across a post regarding Ninfer6000, a fork of Ninfer specifically tuned for Qwen3.8-Flash-Next NVFP4 on RTX 6000 Blackwell. The reported speed numbers were incredible, so I HAD to grab it and benchmark it. If it really was going to bring me from ~150tok/s decode (vLLM + MTP) to well over 300, I needed to see it. More importantly I needed to see if it was lobotomized to achieve those speeds. To accomplish this I’ve run a host of traditional benchmarks to log the speed, size, accuracy, and long context behavior. I’ve also run a couple in-harness tests to compare how the models behave.
The Setup
I used llama-swap to run each one at a time through evalscope 1.8.1 for the scored suites, and a direct runner for RULER. I set concurrency 2 for all runs except one long context RULER test because that fit nicely into my hardware.
| Ninfer6000 | vLLM | llama.cpp | |
|---|---|---|---|
| Checkpoint | Swift 1.5 NVFP4 + FP8 PLE/Proj | NVFP4 (modelopt) | UD-Q4_K_XL |
| KV cache | BF16 | BF16 | Q8_0 |
| Context served | 262,144 | 262,144 | 131,072 (2 streams @ 262k) |
| Speculative decode | MTP, 3 draft tokens | MTP, 2 tokens | MTP, 3 draft tokens |
| Max concurrent requests | 2 | 2 | 2 |
| Prefill / ubatch chunk | 8,192 | 8,192 | 2,048 |
UD-Q4_K_XL’s 131,072-token context is the one asymmetry amongst the trio. The two streams share the single 262,144 token pool in llama.cpp, but none of the tests came near this so the comparisons are still fair in that regard. The deep RULER ladder is the exception. To hit the 256,827 token prompt I dropped it to a single 262,144 token context stream for that benchmark.
Ninfer6000’s model is not perfectly apples to apples to the other two as it is based on a Swift1.5 fine tune geared toward reasoning brevity. That being said, it is the model Ninfer6000 recommends so it stands as how the engine is to be configured.
I first ran a greedy pass with a low max-token cap, then 3 repeats at temp 0.6 and a budget of 16k tokens. Everything going forward refers to the 3-repeat run unless the section says otherwise.
Speed & Size
The sweep: prefill, decode, time-to-first-token
First order of business was verifying the speed difference, with a note on RAM occupied. I measured the prefill, decode, and TTFT (time to first token) one engine at a time, single stream (no concurrency), the same synthetic prompt on all three, five prompt lengths from ~1k to 114k tokens, 512 tokens out, greedy, two reps per cell. I pulled the memory and load numbers from the logs. Prefill at 1k was noisy on each model (vLLM’s two reps were 2.3x apart for example), so treat sub-8k prefill as directional.
Decode: flat, and ~1.5-1.7x vLLM at every length
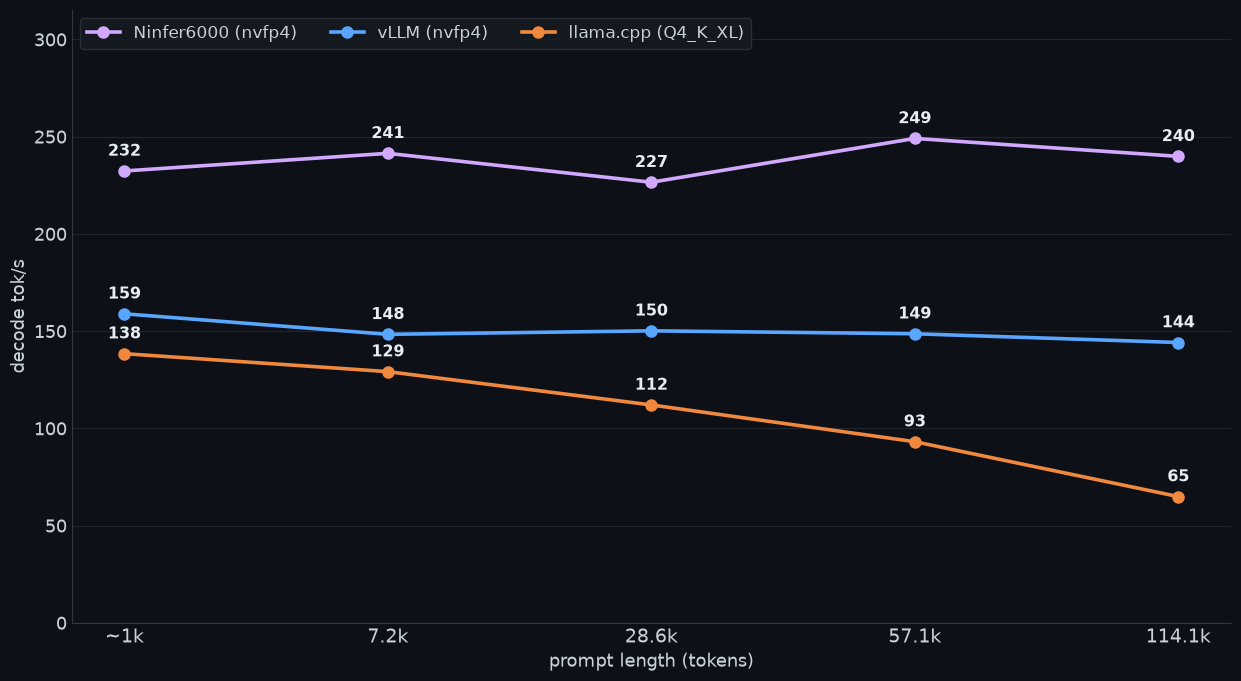
| Prompt | Ninfer6000 | vLLM nvfp4 | llama.cpp Q4_K_XL | N vs vLLM | N vs llama.cpp |
|---|---|---|---|---|---|
| ~1k | 232 | 159 | 138 | 1.46x | 1.68x |
| 7.2k | 241 | 148 | 129 | 1.63x | 1.87x |
| 28.6k | 227 | 150 | 112 | 1.51x | 2.02x |
| 57.1k | 249 | 149 | 93 | 1.68x | 2.67x |
| 114.1k | 240 | 144 | 65 | 1.66x | 3.70x |
| mean | 238 | 150 | 108 | 1.59x | 2.21x |
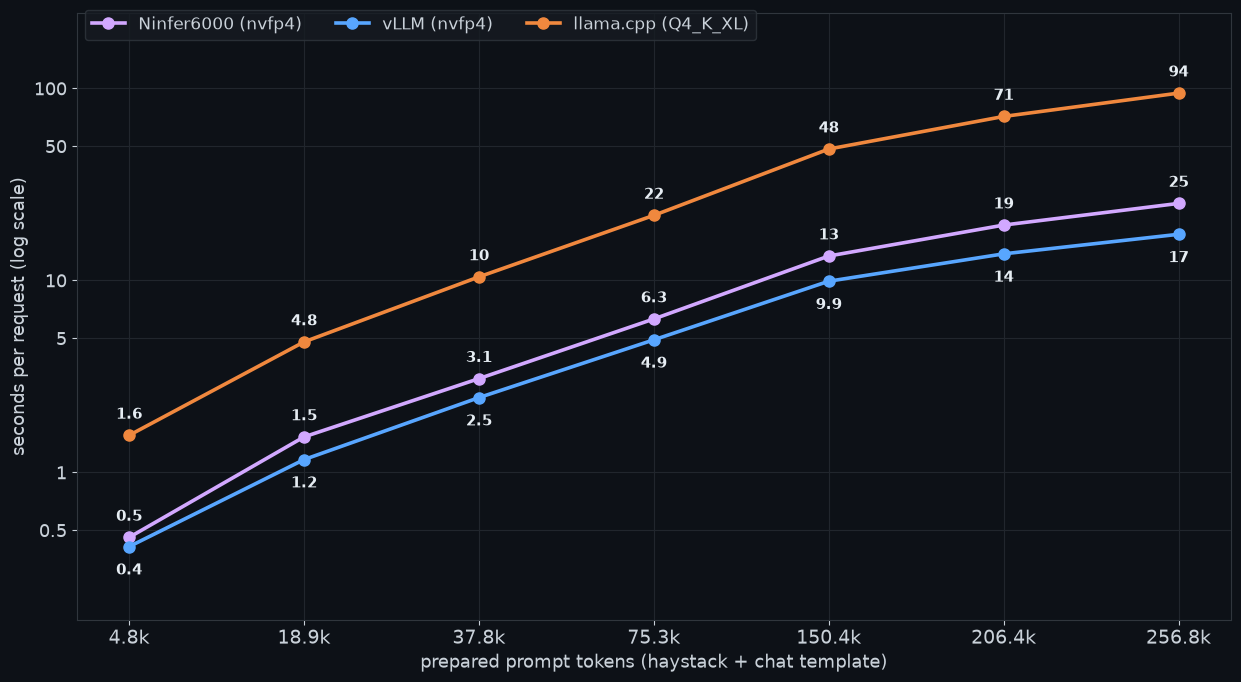
The most significant number here is presented by the purple line: Ninfer6000 averages 238 tok/s, stays consistent at any prompt size (unlike llama.cpp, though I’m sure this will be fixed at some point), and beats vLLM by ~60%. This says nothing of quality/accuracy of course but Ninfer6000’s advertised decode superiority checks out.
Prefill and TTFT: vLLM wins this one, decisively
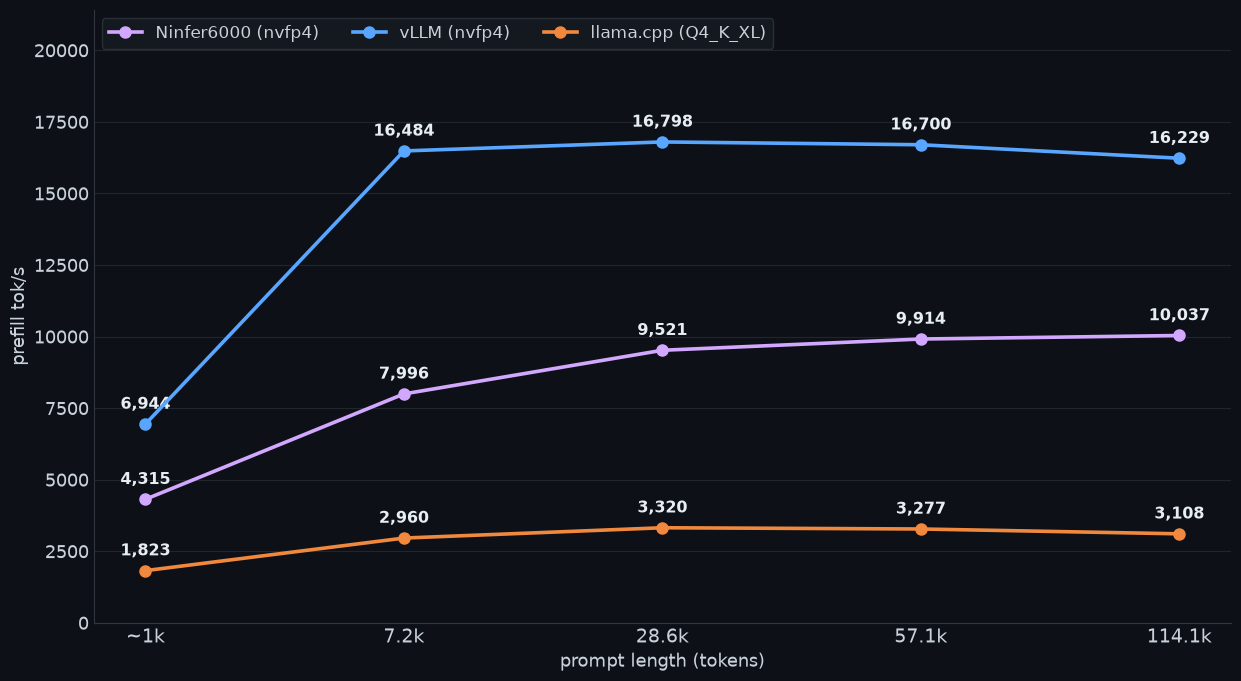
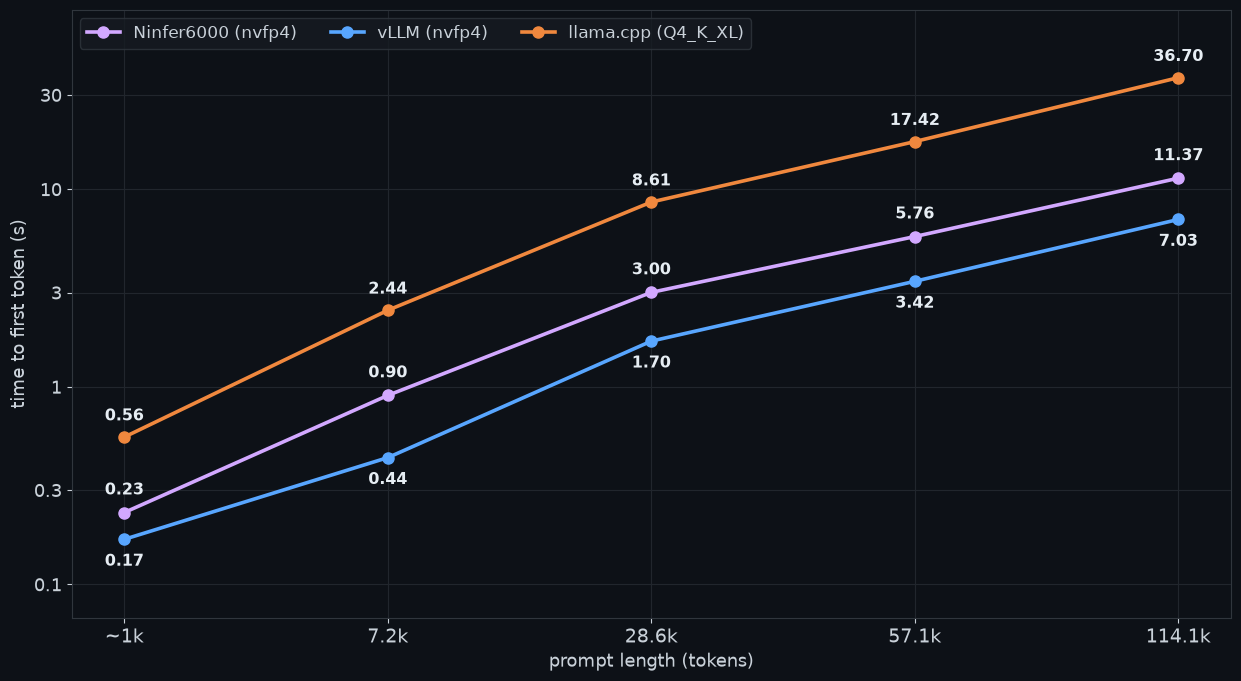
| Prompt | Ninfer6000 prefill | vLLM prefill | llama.cpp prefill | Ninfer TTFT | vLLM TTFT | llama.cpp TTFT |
|---|---|---|---|---|---|---|
| ~1k | 4,315 | 6,944 | 1,823 | 0.23 s | 0.17 s | 0.56 s |
| 7.2k | 7,996 | 16,484 | 2,960 | 0.90 s | 0.44 s | 2.44 s |
| 28.6k | 9,521 | 16,798 | 3,320 | 3.00 s | 1.70 s | 8.61 s |
| 57.1k | 9,914 | 16,700 | 3,277 | 5.76 s | 3.42 s | 17.42 s |
| 114.1k | 10,037 | 16,229 | 3,108 | 11.37 s | 7.03 s | 36.70 s |
vLLM is still the prefill champ: ~16.5k tok/s, flat from 8k to 114k, 1.6-2.1x Ninfer6000. The result is a first token that comes a few seconds earlier. 7.0 s versus 11.4 s on a 114k prompt. Ninfer6000 plateaus at ~10k tok/s, but only finds its stride in the longer prompts. llama.cpp never gets near either, capped at ~3.3k tok/s with a 36.7 second TTFT at 114k.
Quick note on the 1k row: vLLM’s two reps were 2.3x apart, attributable to cold-graph/prefix-cache noise. Not very valuable, better to focus on the 8k+ columns as the real prefill comparison.
End to end: the crossover is output length, not context length
If you consider a real-world use case, both prefill and decode impact the outcome notably. Wall time per request = measured TTFT + (output tokens / decode rate):
| Prompt | Output | Ninfer6000 | vLLM nvfp4 | llama.cpp Q4_K_XL |
|---|---|---|---|---|
| 7.2k | 512 | 3.0 s | 3.9 s | 6.4 s |
| 7.2k | 2,048 | 9.4 s | 14.2 s | 18.3 s |
| 28.6k | 2,048 | 12.0 s | 15.3 s | 26.9 s |
| 57.1k | 8,192 | 38.6 s | 58.5 s | 105.4 s |
| 114.1k | 512 | 13.5 s | 10.6 s | 44.6 s |
| 114.1k | 2,048 | 19.9 s | 21.2 s | 68.3 s |
| 114.1k | 8,192 | 45.5 s | 63.9 s | 162.9 s |
Setting the two projections equal gives the crossover - the output length at which Ninfer6000’s decode lead repays its prefill debt:
| Prompt | ~1k | 7.2k | 28.6k | 57.1k | 114.1k |
|---|---|---|---|---|---|
| Crossover, output tokens | 31 | 179 | 580 | 863 | 1,567 |
So the nuanced conclusion of which is better would be “it depends”. Ask the model for a one-line answer on a huge prompt and vLLM cooks. Ask it for anything a human would call an answer (a paragraph, a diff, a tool trace) and Ninfer6000 wins at every prompt length, and the margin grows (1.4x faster end-to-end at 114k prompt / 8k output). Chat and agent traffic often sits on the long-output side of that line, so I’m personally inclined to lean toward the decode leader, but I also acknowledge prefill wins can be more perceivable to the end user in chat after a certain decode speed. llama.cpp is on the wrong side of both: 163 seconds for that same 114k/8k request. Oof.
Cold start, VRAM, and where the memory goes
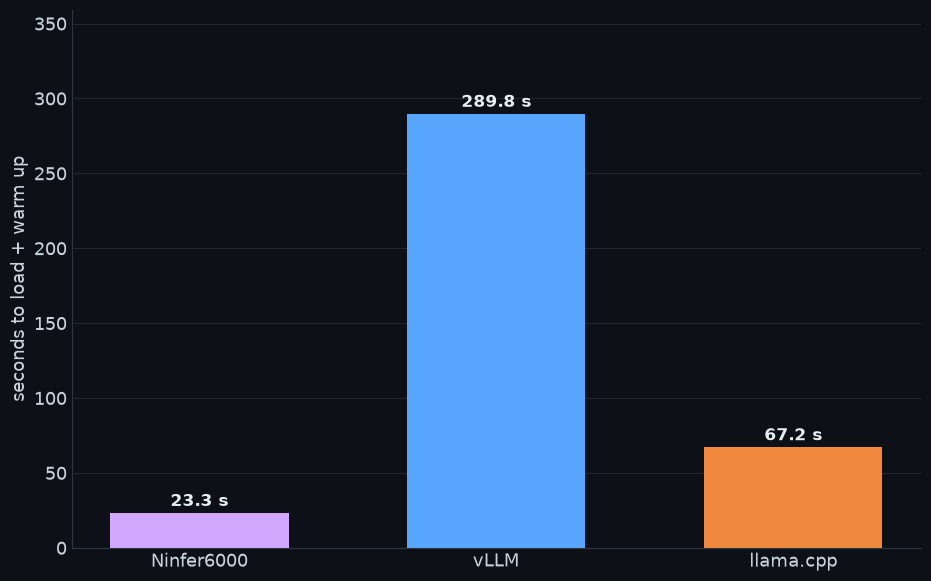
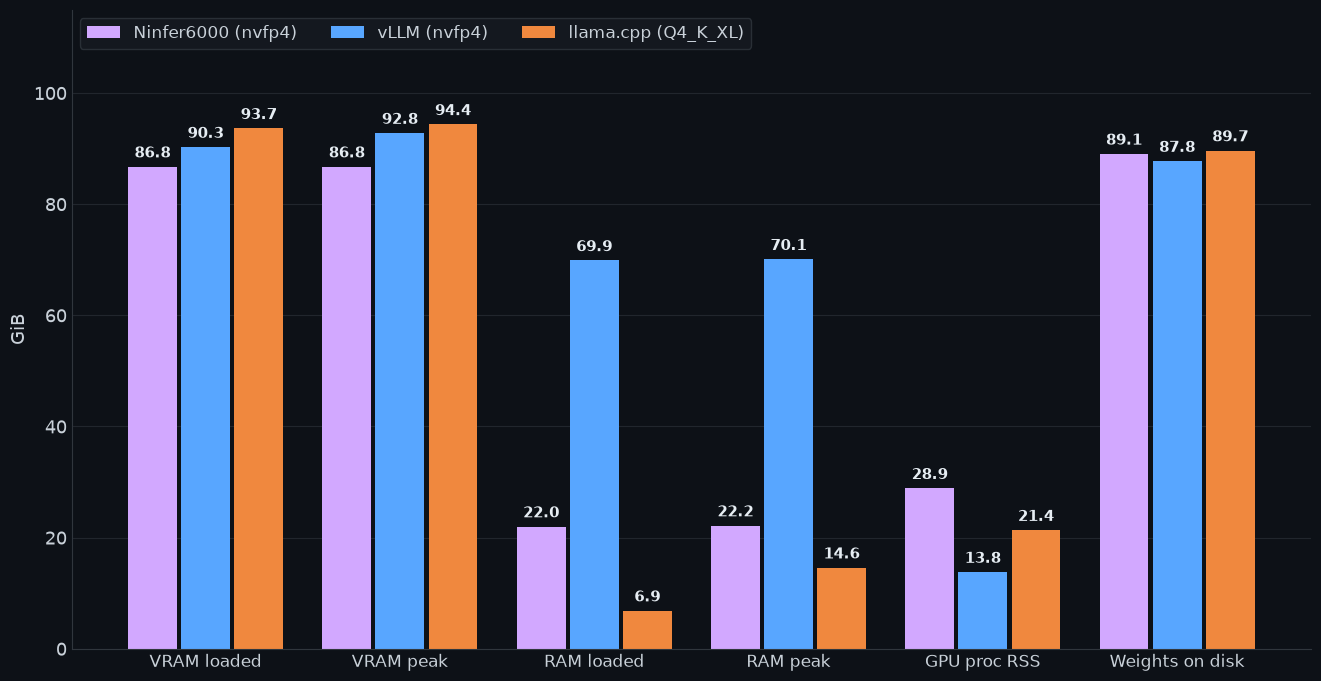
| Ninfer6000 | vLLM nvfp4 | llama.cpp Q4_K_XL | |
|---|---|---|---|
| Artifact | swift_1_5 _nvfp4 _fp8ple _fp8proj.ninfer | nvfp4 (modelopt) | UD-Q4_K_XL + mmproj-BF16 + MTP draft Q8_0 |
| Time to first ready request | 23 s | 290 s | 67 s |
| VRAM after load | 86.8 GiB | 90.3 GiB | 93.7 GiB |
| VRAM peak (131k prompt) | 86.8 GiB | 92.8 GiB | 94.4 GiB |
| Host RAM peak | 22.2 GiB | 70.1 GiB | 14.6 GiB |
| KV cache dtype | BF16 | BF16 | Q8_0 |
Three points of intrigue here.
First observation, all three fit on one 96 GB card.
Second, vLLM’s 290-second boot is a big price for that prefill lead. I do a lot of experimenting and model swapping on this rig, so startup time actually matters to me. It would be nice to have a whole machine dedicated to high availability vLLM multi-user serving, but this is real life. Ninfer6000 is serving traffic 23 seconds after a request cold-start and has probably finished its response by the time nvfp4 has even begun to prefill.
Third, memory fill varies greatly. vLLM sits at 70 GiB of RAM because I ran it with VLLM_PLE_CPU_OFFLOAD=1. The n-gram table state lives in system memory and streams in, which is also likely part of where that prefill efficiency comes from. llama.cpp memory-maps the GGUF and lets the page cache deal with the rest. Ninfer6000 actually uses the least VRAM of the three.
In action: what the benchmark runs themselves measured
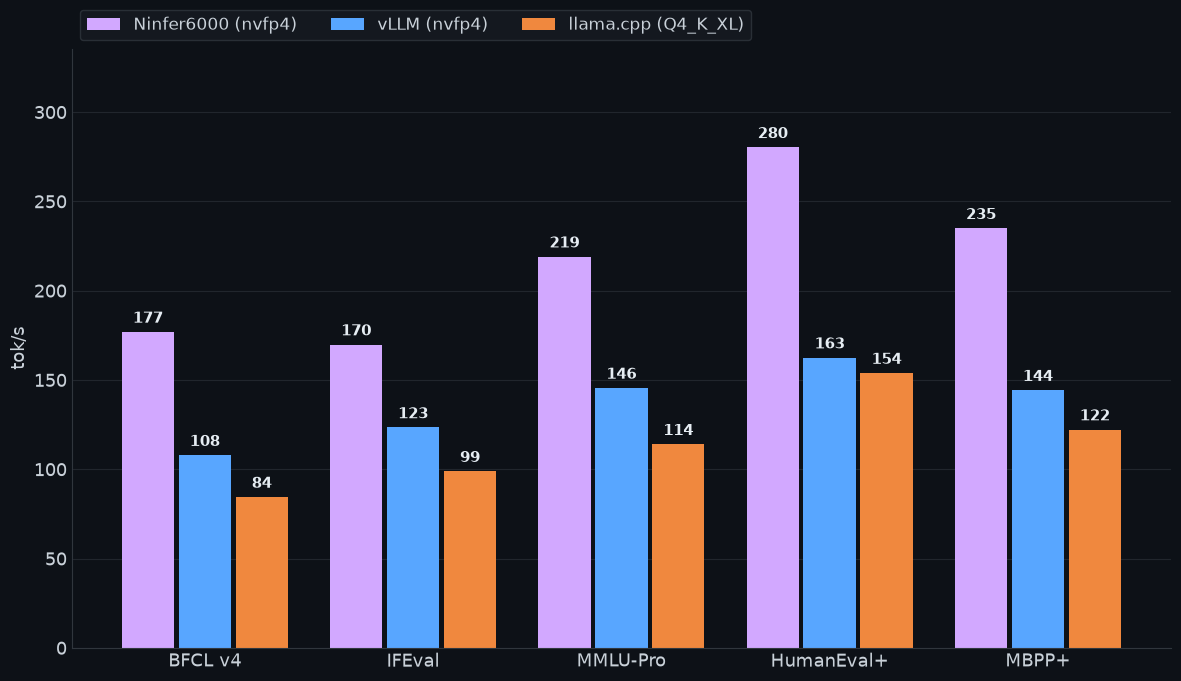
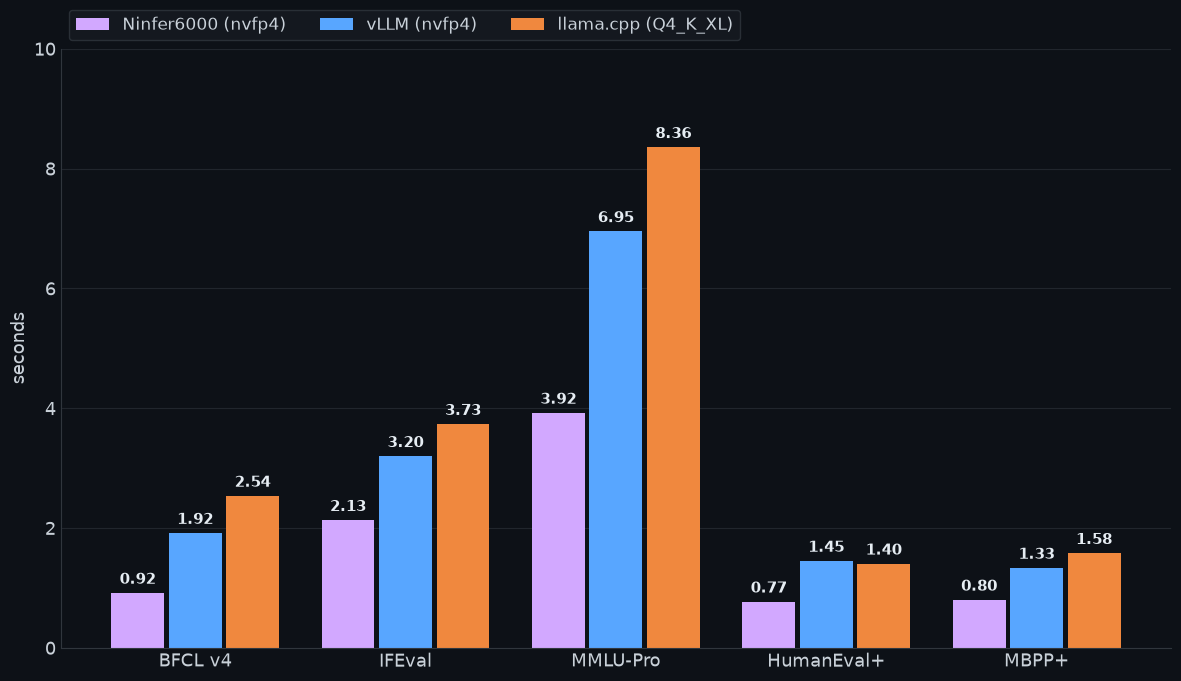
The sweep above is single-stream and synthetic. The scored suites are the opposite and nonetheless agree on direction.
📊 Expand Speed Tables
Output tokens/s (mean per request)
| Benchmark | Requests | Ninfer6000 | vLLM nvfp4 | llama.cpp Q4_K_XL |
|---|---|---|---|---|
| BFCL v4 | ~3,000 | 176.9 | 107.9 | 84.5 |
| IFEval | 750 | 169.8 | 123.4 | 98.9 |
| MMLU-Pro | 1,260 | 219.0 | 145.5 | 114.0 |
| HumanEval+ | 492 | 280.3 | 162.5 | 153.9 |
| MBPP+ | 1,134 | 234.9 | 144.3 | 122.2 |
| Arena-Hard (long-form) | 75 | 137.9 | 59.2 | 50.6 |
End-to-end latency, seconds per request
| Benchmark | Ninfer6000 mean | vLLM mean | llama.cpp mean | Ninfer6000 p95 | vLLM p95 | llama.cpp p95 |
|---|---|---|---|---|---|---|
| BFCL v4 | 0.92 | 1.92 | 2.54 | - | - | - |
| IFEval | 2.13 | 3.20 | 3.73 | 6.9 | 9.9 | 11.3 |
| MMLU-Pro | 3.92 | 6.95 | 8.36 | 10.7 | 19.4 | 23.5 |
| HumanEval+ | 0.77 | 1.45 | 1.40 | 1.6 | 3.7 | 2.6 |
| MBPP+ | 0.80 | 1.33 | 1.58 | 1.7 | 3.2 | 3.9 |
| Arena-Hard | 45.96 | 149.63 | 171.22 | 193 | 551 | 450 |
| RULER (suite pass, 4k-64k) | 2.76 | 2.18 | 9.64 | - | - | - |
Same ranking, wider spread. RULER is the one row where vLLM wins the wall clock as it was basically all prefill so that tracks. Both views support the Reddit post’s claims (even if they were a bit rounded-up and best-case focused).
Traditional Benchmarks
note these are not comparable to leaderboards - different sample size, different Arena Hard judge.
The scoreboard
| Benchmark | Samples | Ninfer6000 | vLLM nvfp4 | llama.cpp Q4_K_XL | Spread |
|---|---|---|---|---|---|
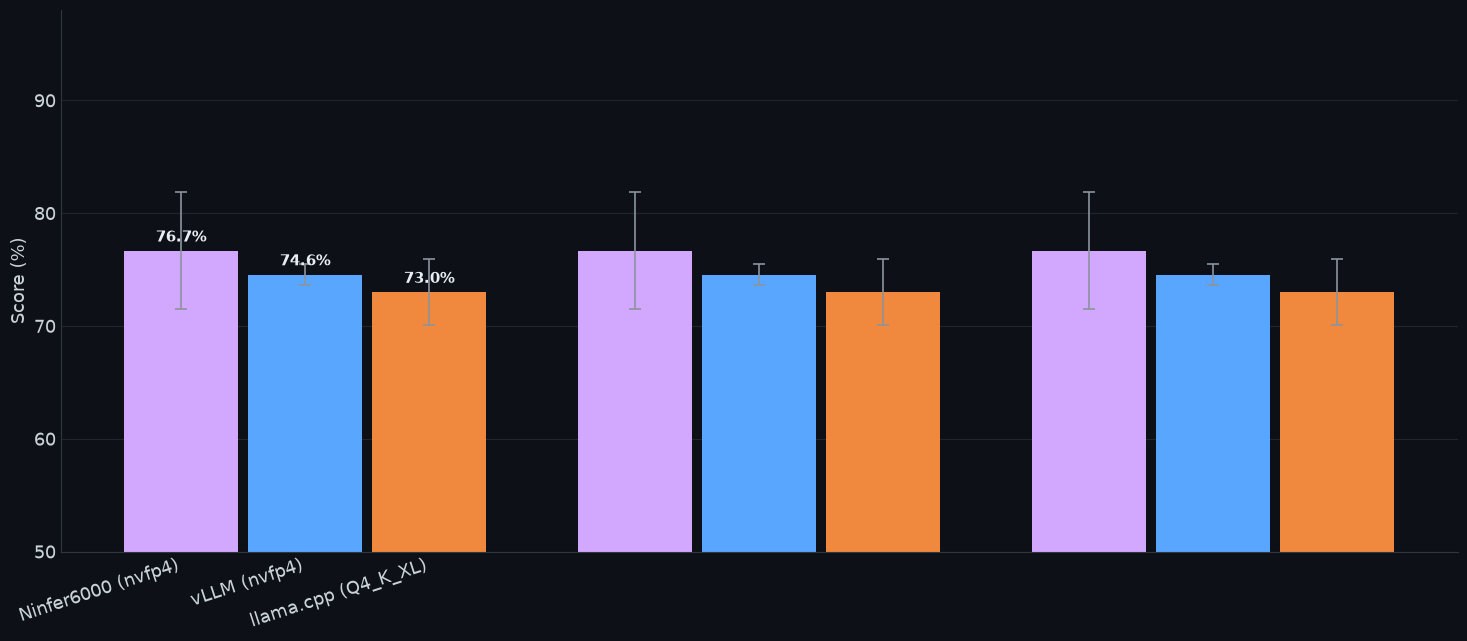
| Tool calling (BFCL v4) | 300 | 76.67 ± 5.21 | 74.56 ± 0.96 | 73.00 ± 2.96 | 3.7 |
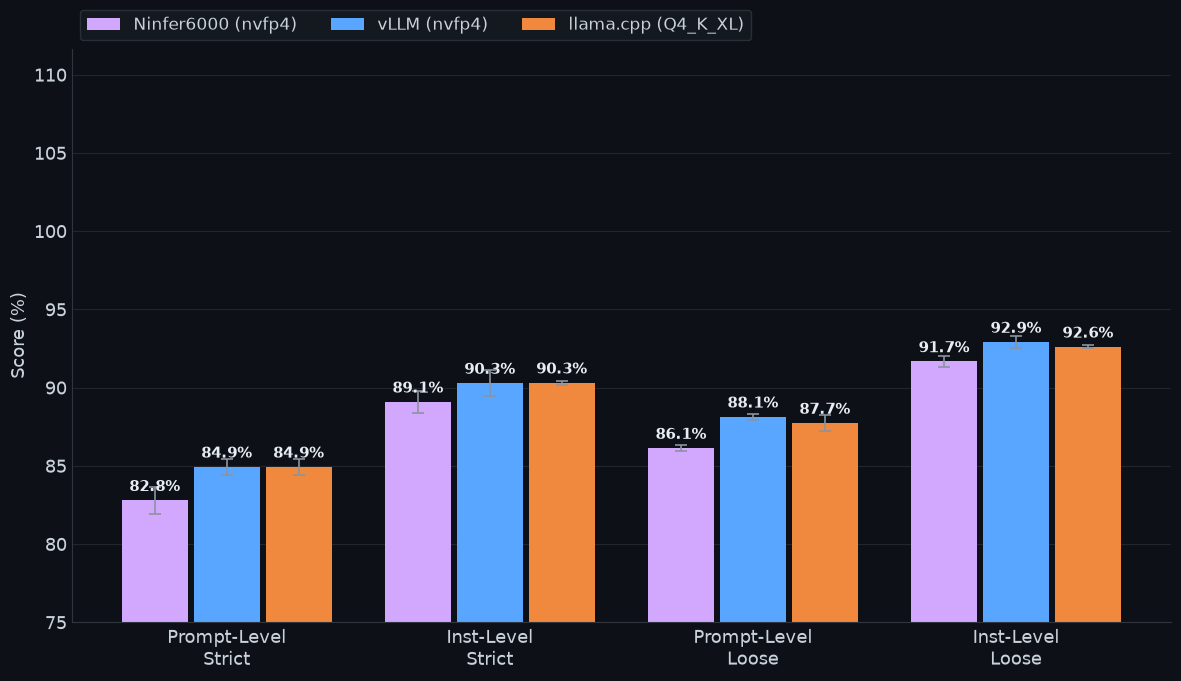
| Instruction following (IFEval, prompt-strict) | 250 | 82.80 ± 1.06 | 84.93 ± 0.61 | 84.93 ± 0.61 | 2.1 |
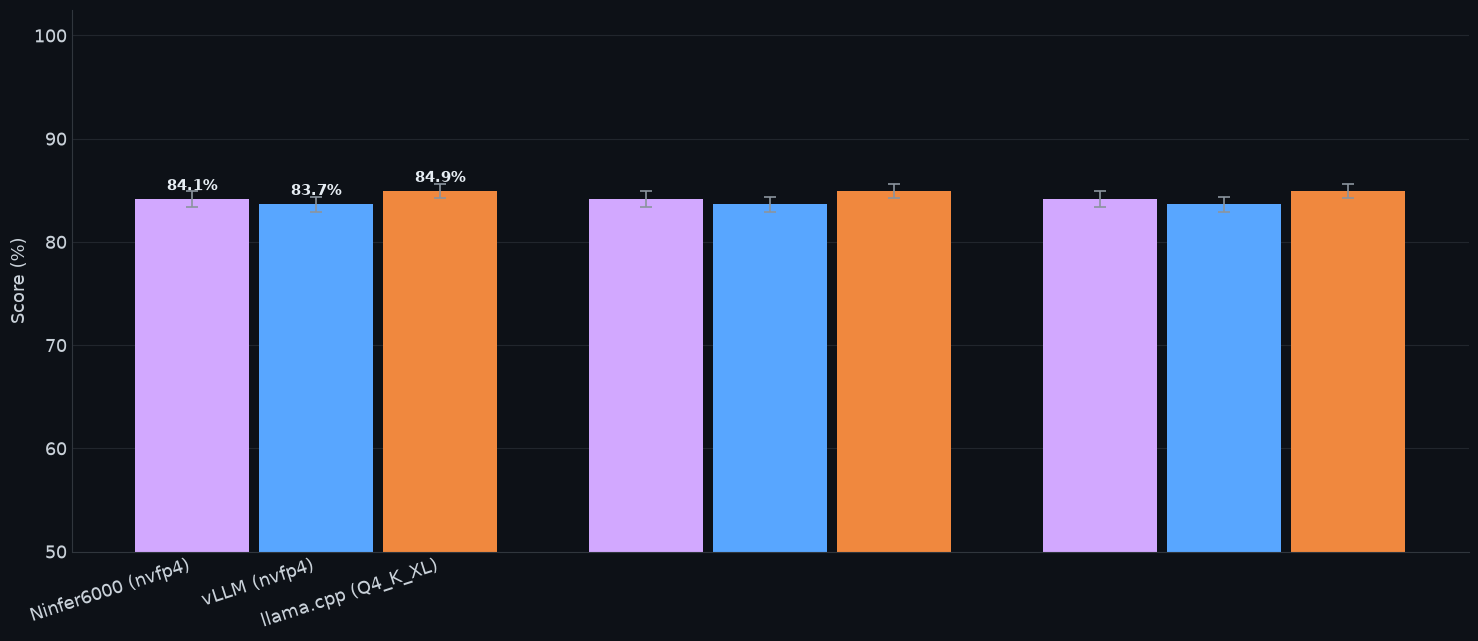
| Knowledge (MMLU-Pro) | 420 | 84.13 ± 0.77 | 83.65 ± 0.73 | 84.92 ± 0.69 | 1.3 |
| Code (HumanEval+) | 164 | 93.29 ± 0.61 | 94.92 ± 0.35 | 93.90 ± 1.22 | 1.6 |
| Code (MBPP+) | 378 | 94.80 ± 0.31 | 95.15 ± 1.07 | 95.59 ± 0.76 | 0.8 |
| Long-form (Arena-Hard) | 75 | 81.48 | 76.07 | 77.42 | 5.41 |
| Long context (RULER, 4k to 257k) | 290 | 98.28 | 99.14 | 98.97 | 0.9 |
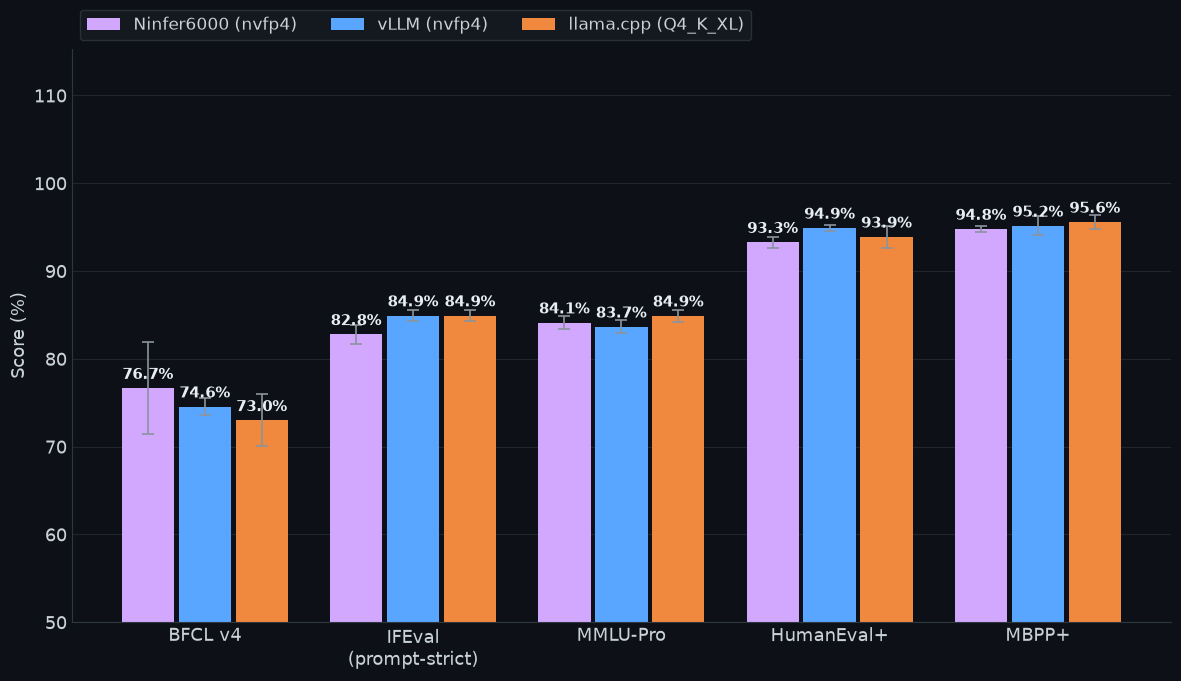
Five of seven results sit inside a 2.1-point band. These results support the conclusion that the engine swap mostly changes speed and not accuracy/capability. The exceptions were BFCL v4 (3.7, replicated direction) and Arena-Hard (4.7, single pass and mostly an answer-length effect). (RULER’s row is not a 3-repeat mean. It is the result from the deep ladder only run once, thus not in the chart below).
The noise floor
📊 Expand Noise Floor Table
| Benchmark | Slot | Run 1 / 2 / 3 | Mean ± SD | Range |
|---|---|---|---|---|
| Tool calling | Ninfer6000 | 82.67 / 74.00 / 73.33 | 76.67 ± 5.21 | 9.33 |
| Tool calling | vLLM nvfp4 | 75.67 / 74.00 / 74.00 | 74.56 ± 0.96 | 1.67 |
| Tool calling | llama.cpp Q4_K_XL | 76.33 / 70.67 / 72.00 | 73.00 ± 2.96 | 5.67 |
| Instruction following | Ninfer6000 | 82.40 / 82.00 / 84.00 | 82.80 ± 1.06 | 2.00 |
| Instruction following | vLLM nvfp4 | 84.80 / 85.60 / 84.40 | 84.93 ± 0.61 | 1.20 |
| Instruction following | llama.cpp Q4_K_XL | 84.40 / 84.80 / 85.60 | 84.93 ± 0.61 | 1.20 |
| Knowledge | Ninfer6000 | 85.00 / 83.81 / 83.57 | 84.13 ± 0.77 | 1.43 |
| Knowledge | vLLM nvfp4 | 83.81 / 82.86 / 84.29 | 83.65 ± 0.73 | 1.43 |
| Knowledge | llama.cpp Q4_K_XL | 84.52 / 84.52 / 85.71 | 84.92 ± 0.69 | 1.19 |
| Code (HumanEval+) | Ninfer6000 | 93.29 / 92.68 / 93.90 | 93.29 ± 0.61 | 1.22 |
| Code (HumanEval+) | vLLM nvfp4 | 95.12 / 95.12 / 94.51 | 94.92 ± 0.35 | 0.61 |
| Code (HumanEval+) | llama.cpp Q4_K_XL | 92.68 / 95.12 / 93.90 | 93.90 ± 1.22 | 2.44 |
| Code (MBPP+) | Ninfer6000 | 94.44 / 94.97 / 94.97 | 94.80 ± 0.31 | 0.53 |
| Code (MBPP+) | vLLM nvfp4 | 96.30 / 94.18 / 94.97 | 95.15 ± 1.07 | 2.12 |
| Code (MBPP+) | llama.cpp Q4_K_XL | 96.03 / 94.71 / 96.03 | 95.59 ± 0.76 | 1.32 |
Ninfer6000’s BFCL row swings 9.3 points across three repeats. N=300 clearly isn’t enough to separate them on its own, but we can still make directional observations and do per-sample pairing below.
📊 Expand Paired Significance Table
Exact McNemar on the paired samples, run per repeat, Holm-corrected within each benchmark. net is the discordant-pair count per repeat (arm vs base); p vote is the conservative majority-vote estimator across repeats.
| Benchmark | Pair (arm vs base) | Δ pts (repeat 1) | net per repeat | p | p Holm | p vote | Sig | Replicated |
|---|---|---|---|---|---|---|---|---|
| Tool calling | vLLM vs Ninfer6000 | -7.00 | -21 / +0 / +2 | <0.001 | <0.001 | 0.8145 | yes | no |
| Tool calling | Ninfer6000 vs llama.cpp | +6.33 | +19 / +10 / +4 | 0.0013 | 0.0026 | 0.5034 | yes | yes |
| Tool calling | vLLM vs llama.cpp | -0.67 | -2 / +10 / +6 | 0.8238 | 0.8238 | 0.8238 | no | direction |
| Instruction following | vLLM vs Ninfer6000 | +2.40 | +6 / +9 / +1 | 0.3616 | 1.0 | 0.3018 | no | direction |
| Instruction following | Ninfer6000 vs llama.cpp | -2.00 | -5 / -7 / -4 | 0.4583 | 1.0 | 0.6072 | no | direction |
| Instruction following | vLLM vs llama.cpp | +0.40 | +1 / +2 / -3 | 1.0 | 1.0 | 0.7539 | no | direction |
| Knowledge | vLLM vs Ninfer6000 | -1.19 | -5 / -4 / +3 | 0.4421 | 1.0 | 1.0 | no | direction |
| Knowledge | vLLM vs llama.cpp | -0.71 | -3 / -7 / -6 | 0.7111 | 1.0 | 0.6072 | no | direction |
| Knowledge | Ninfer6000 vs llama.cpp | +0.48 | +2 / -3 / -9 | 0.8555 | 1.0 | 0.4545 | no | direction |
| Code (HumanEval+) | vLLM vs llama.cpp | +2.44 | +4 / +0 / +1 | 0.3438 | 1.0 | 0.25 | no | direction |
| Code (HumanEval+) | vLLM vs Ninfer6000 | +1.83 | +3 / +4 / +1 | 0.4531 | 1.0 | 0.0625 | no | direction |
| Code (HumanEval+) | Ninfer6000 vs llama.cpp | +0.61 | +1 / -4 / +0 | 1.0 | 1.0 | 0.7266 | no | no |
| Code (MBPP+) | vLLM vs Ninfer6000 | +1.85 | +7 / -3 / +0 | 0.0391 | 0.1172 | 1.0 | no | no |
| Code (MBPP+) | Ninfer6000 vs llama.cpp | -1.59 | -6 / +1 / -4 | 0.1094 | 0.2188 | 0.2891 | no | direction |
| Code (MBPP+) | vLLM vs llama.cpp | +0.26 | +1 / -2 / -4 | 1.0 | 1.0 | 0.2891 | no | direction |
Two rows hold up to Holm correction, and all both are BFCL rows involving Ninfer6000. The Ninfer6000-vs-vLLM row is exactly the trap this layout exists to catch while Ninfer6000-vs-llama.cpp is real. +19 / +10 / +4, same sign all three times, Holm p=0.0026.
BFCL v4
Details: 50 samples, 6 subsets → 300 samples, 3 repeats
📊 Expand Data Tables
Overall (3 repeats)
| Slot | Accuracy | SD | Repeats |
|---|---|---|---|
| Ninfer6000 | 76.67% | 5.21 | 82.67 / 74.00 / 73.33 |
| vLLM nvfp4 | 74.56% | 0.96 | 75.67 / 74.00 / 74.00 |
| llama.cpp Q4_K_XL | 73.00% | 2.96 | 76.33 / 70.67 / 72.00 |
By Subset (n=50, mean ± SD over 3 repeats)
| Subset | Ninfer6000 | vLLM nvfp4 | llama.cpp Q4_K_XL | Best |
|---|---|---|---|---|
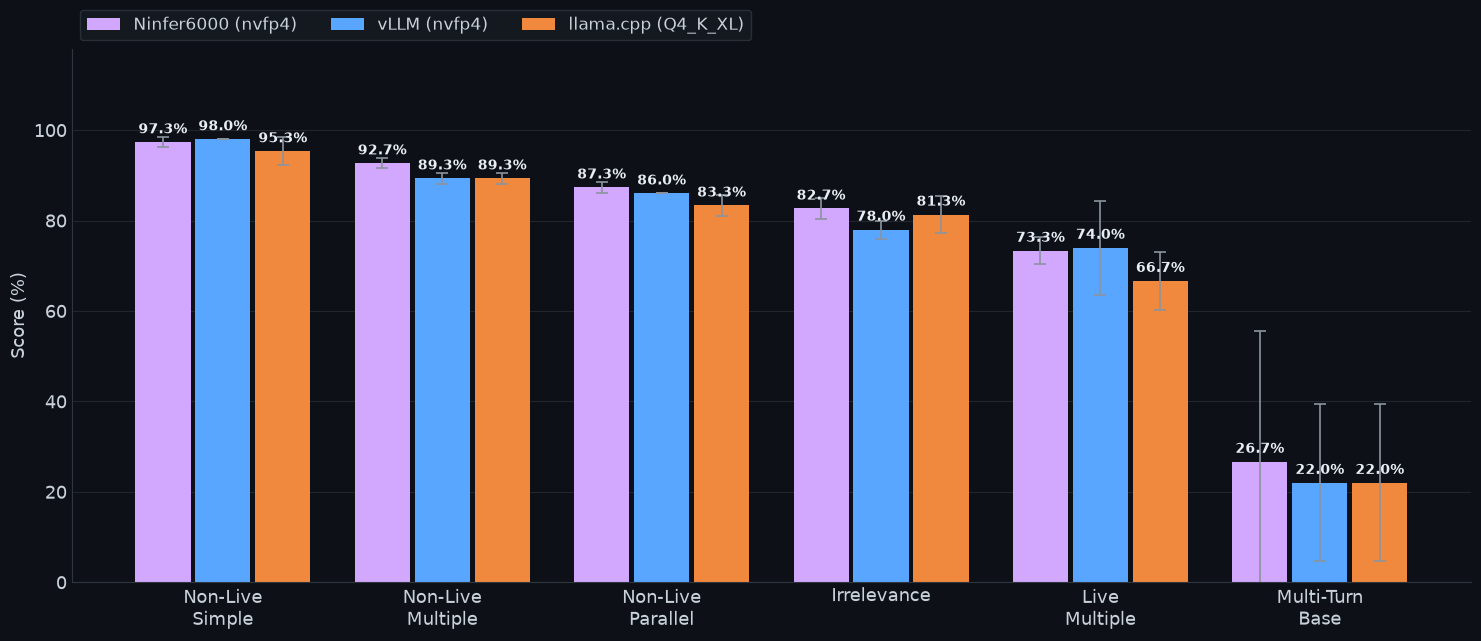
| Simple Python | 97.3 ± 0.9 | 98.0 ± 0.0 | 95.3 ± 2.5 | vLLM |
| Multiple | 92.7 ± 0.9 | 89.3 ± 0.9 | 89.3 ± 0.9 | Ninfer6000 |
| Parallel | 87.3 ± 0.9 | 86.0 ± 0.0 | 83.3 ± 1.9 | Ninfer6000 |
| Live Multiple | 73.3 ± 2.5 | 74.0 ± 8.5 | 66.7 ± 5.2 | vLLM |
| Irrelevance | 82.7 ± 1.9 | 78.0 ± 1.6 | 81.3 ± 3.4 | Ninfer6000 |
| Multi-Turn Base | 26.7 ± 23.6 | 22.0 ± 14.1 | 22.0 ± 14.1 | Ninfer6000 |
Most categories had an insignificant gap, but multi_turn_base stood out quite a bit. The greedy first run scored it 54 / 42 / 42 and ended up with a massive band. Treat BFCL’s direction as real and its magnitude as multi-turn luck. Ninfer6000 is ahead on tool calling, somewhere between +2 and +4 points on the mean.
IFEval
Details: 250 samples, 3 repeats, all four metrics
📊 Expand Data Tables
| IFEval metric (mean of 3 repeats) | Ninfer6000 | vLLM nvfp4 | llama.cpp Q4_K_XL | Best |
|---|---|---|---|---|
| Prompt-level strict | 82.80 | 84.93 | 84.93 | vLLM / llama.cpp |
| Instruction-level strict | 89.09 | 90.29 | 90.31 | llama.cpp |
| Prompt-level loose | 86.13 | 88.13 | 87.73 | vLLM |
| Instruction-level loose | 91.67 | 92.91 | 92.60 | vLLM |
Ninfer6000 is behind on every metric in all three repeats for instruction following. Directionally consistent, small magnitude. Interestingly the initial greedy run gap was greater, at -6.0 points. Roughly two thirds of it was decoding conditions.
MMLU-Pro
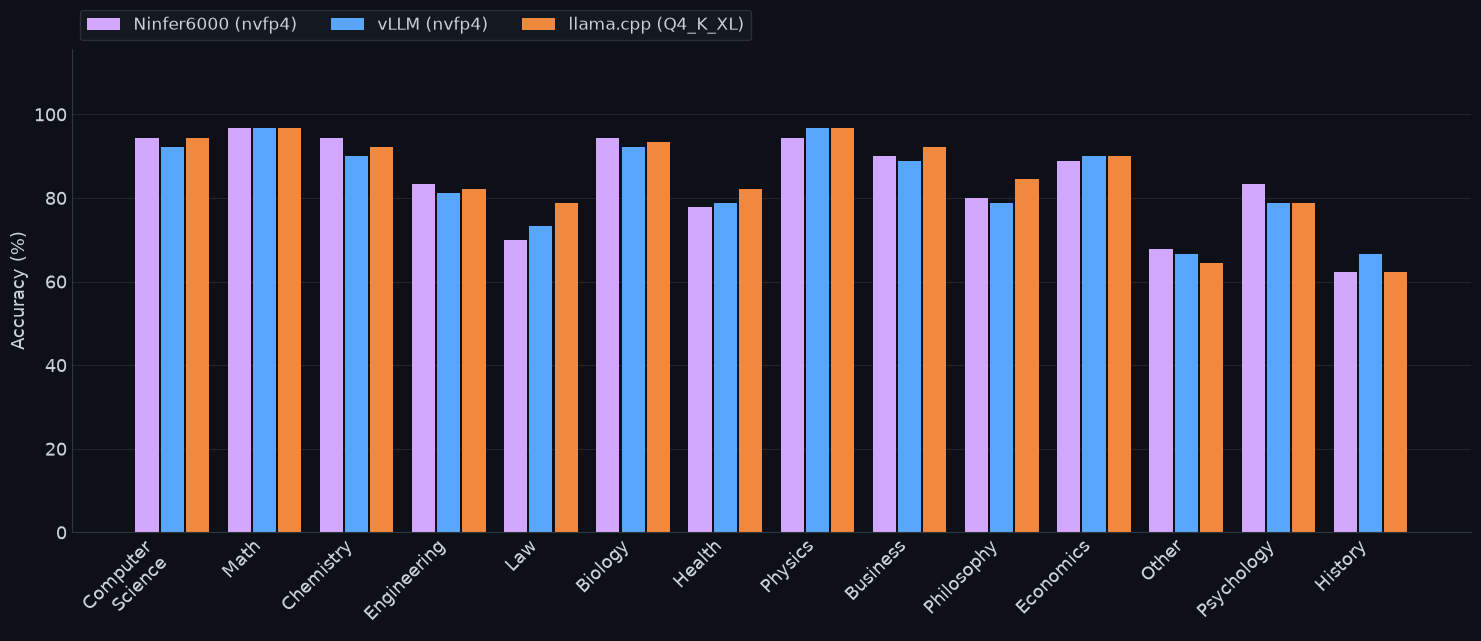
Details: 30 samples, 14 categories → 420 samples, 3 repeats
📊 Expand Data Tables
Overall
| Slot | Accuracy | SD | Repeats |
|---|---|---|---|
| Ninfer6000 | 84.13% | 0.77 | 85.00 / 83.81 / 83.57 |
| vLLM nvfp4 | 83.65% | 0.73 | 83.81 / 82.86 / 84.29 |
| llama.cpp Q4_K_XL | 84.92% | 0.69 | 84.52 / 84.52 / 85.71 |
By Category (mean of 3 repeats, 30 samples each)
| Category | Ninfer6000 | vLLM nvfp4 | llama.cpp Q4_K_XL |
|---|---|---|---|
| Math | 96.7% | 96.7% | 96.7% |
| Computer Science | 94.4% | 92.2% | 94.4% |
| Biology | 94.4% | 92.2% | 93.3% |
| Physics | 94.4% | 96.7% | 96.7% |
| Chemistry | 94.4% | 90.0% | 92.2% |
| Business | 90.0% | 88.9% | 92.2% |
| Economics | 88.9% | 90.0% | 90.0% |
| Engineering | 83.3% | 81.1% | 82.2% |
| Psychology | 83.3% | 78.9% | 78.9% |
| Philosophy | 80.0% | 78.9% | 84.4% |
| Health | 77.8% | 78.9% | 82.2% |
| Law | 70.0% | 73.3% | 78.9% |
| Other | 67.8% | 66.7% | 64.4% |
| History | 62.2% | 66.7% | 62.2% |
This is a shuffle. Quantization format and serving stack seemingly do not move this model’s capabilities on closed-book QA.
HumanEval+ & MBPP+
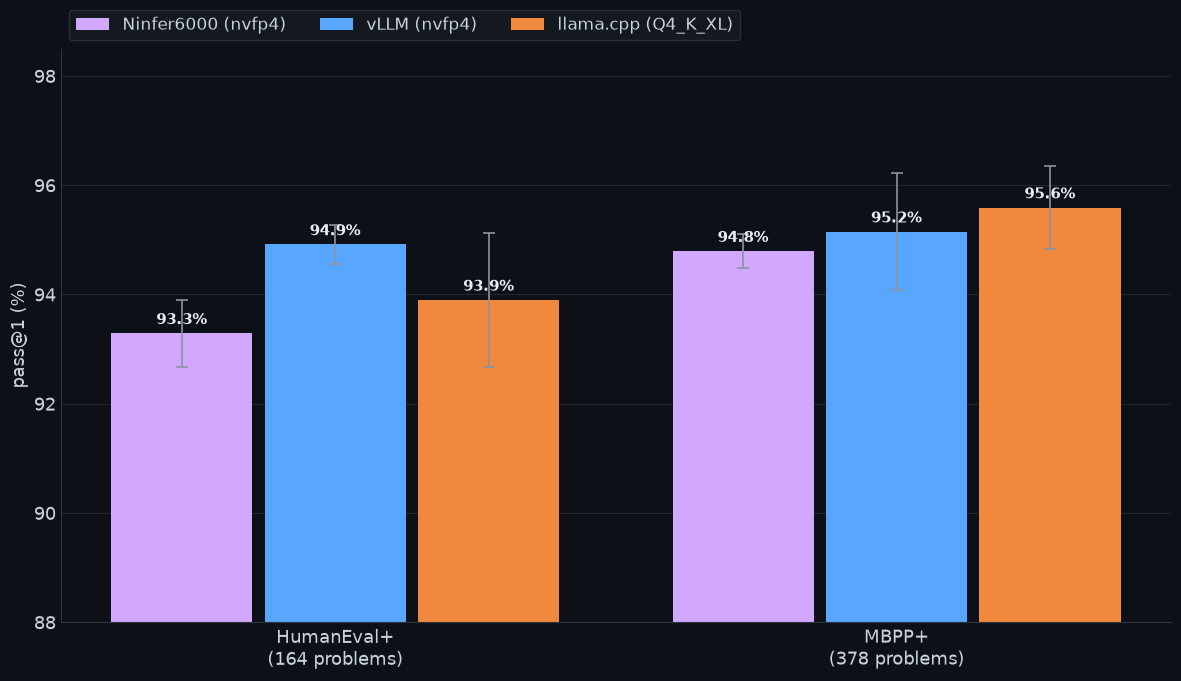
Details: 164 and 378 problems, 3 repeats
📊 Expand Data Tables
| Benchmark | Ninfer6000 | vLLM nvfp4 | llama.cpp Q4_K_XL | Spread |
|---|---|---|---|---|
| HumanEval+ pass@1 | 93.29 ± 0.61 | 94.92 ± 0.35 | 93.90 ± 1.22 | 1.6 |
| MBPP+ pass@1 | 94.80 ± 0.31 | 95.15 ± 1.07 | 95.59 ± 0.76 | 0.8 |
MBPP+ is saturated on all three. Insignificant gaps, and in the one signficant spot the sign flips per result. HumanEval+ vLLM beats Ninfer6000 on all three repeats with a directional (but insignificant) gap and beats llama.cpp on two of three.
Arena-Hard
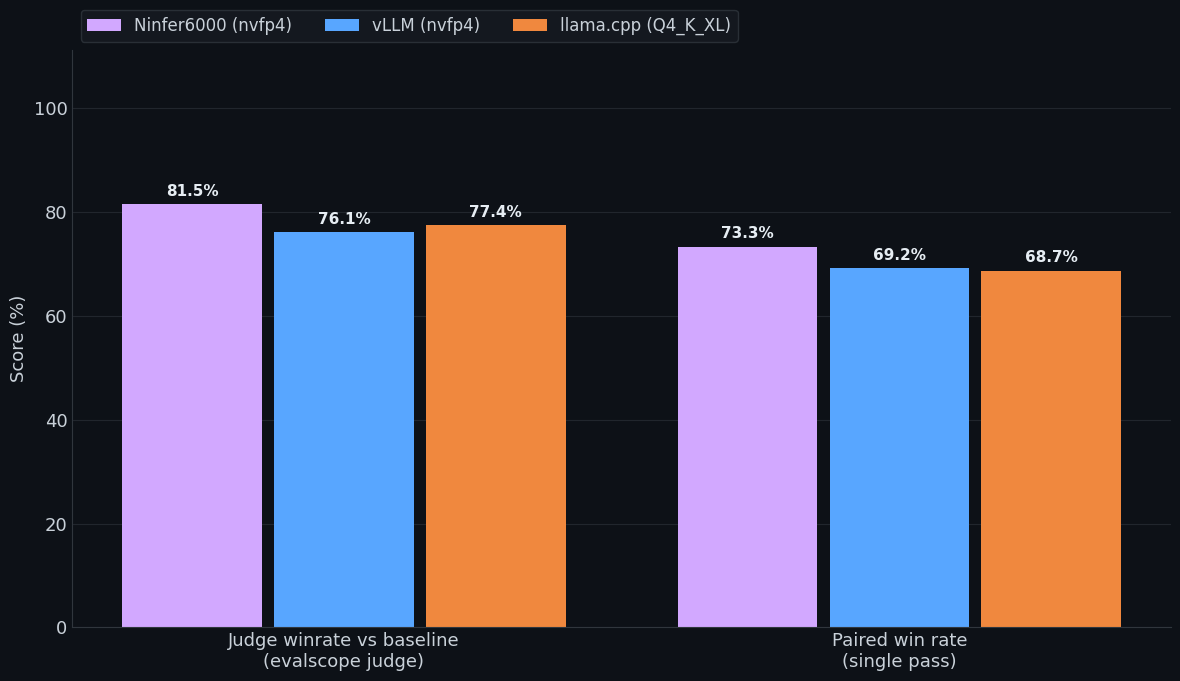
Details: 500 prompts, 75 judged, single pass, temp 0.6, 16,384 token cap
📊 Expand Data Tables
| Slot | Judge winrate vs baseline | Paired win rate | Median answer (tok) | Answers at cap | Latency p95 |
|---|---|---|---|---|---|
| Ninfer6000 | 81.48% | 73.33% | 4,717 | 14/75 (18.7%) | 193 s |
| vLLM nvfp4 | 76.07% | 69.17% | 7,323 | 24/75 (32.0%) | 551 s |
| llama.cpp Q4_K_XL | 77.42% | 68.67% | 7,232 | 20/75 (26.7%) | 450 s |
Without scrutiny Ninfer6000 looks to be superior here, but this mostly comes down to answer-brevity. With Ninfer6000 running a Swift1.5 tuned model it leans toward concise answers, resulting in fewer cutoffs and greater scoring. That isn’t to say this means nothing though. The latency would feel very different in real world applications.
RULER
Details: 290 items per slot, haystack tiers from 4,096 to 224,000 tokens, 9 tasks, seed 69, greedy, 128-token answers, one stream, one pass.
The RULER pass inside the scored suites stopped at 64k and could not separate these engines, so I re-ran the ladder all the way to the edge of the context slot. 30,134,410 prompt tokens per engine and the same haystacks on all three. Tier names are just haystack tokens. The chat template plus re-tokenisation inflates the prompt by ~15%, so the “224k” tier is really a 256,827-token prompt inside a 262,144-token slot with 4,885 tokens left for the answer.
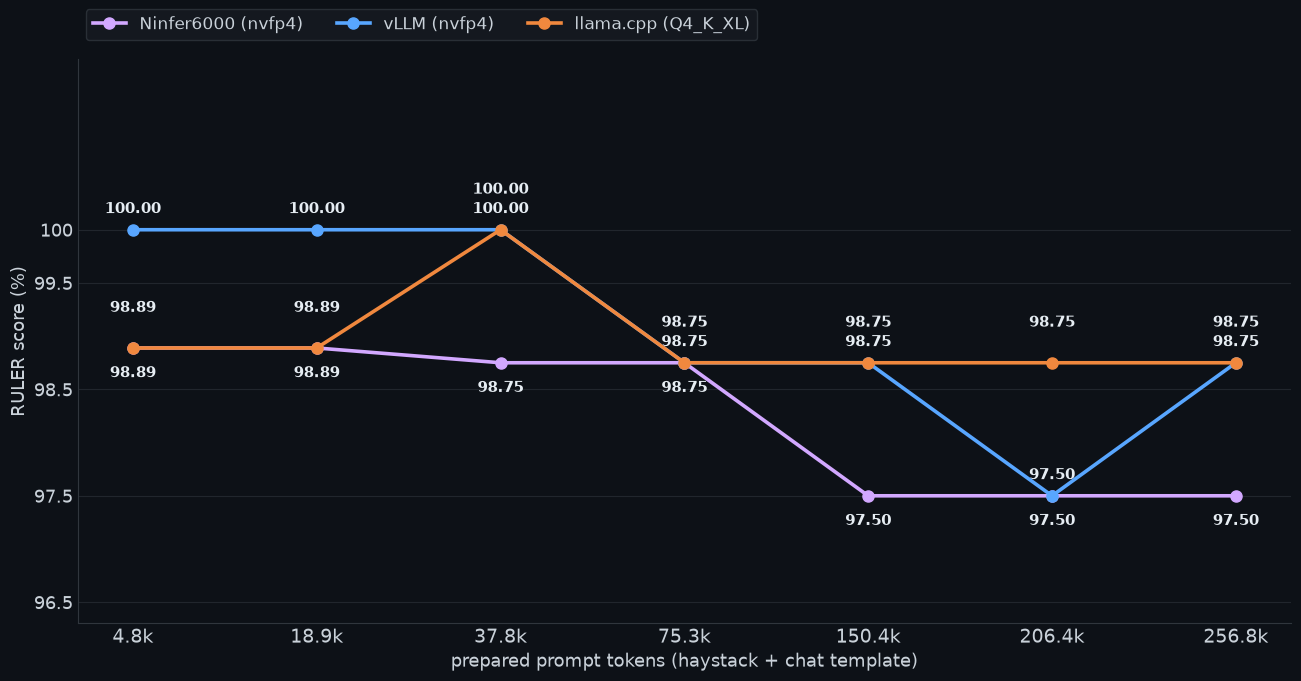
| Haystack | Actual prompt tokens | Ninfer6000 | vLLM nvfp4 | llama.cpp Q4_K_XL | Spread | Items |
|---|---|---|---|---|---|---|
| 4,096 | 4,820 | 98.89 | 100.00 | 98.89 | 1.11 | 45 |
| 16,384 | 18,910 | 98.89 | 100.00 | 98.89 | 1.11 | 45 |
| 32,768 | 37,754 | 98.75 | 100.00 | 100.00 | 1.25 | 40 |
| 65,536 | 75,294 | 98.75 | 98.75 | 98.75 | 0.00 | 40 |
| 131,072 | 150,371 | 97.50 | 98.75 | 98.75 | 1.25 | 40 |
| 180,000 | 206,418 | 97.50 | 97.50 | 98.75 | 1.25 | 40 |
| 224,000 | 256,827 | 97.50 | 98.75 | 98.75 | 1.25 | 40 |
| all 290 | - | 98.28 | 99.14 | 98.97 | 0.86 | 290 |
Retrieval does not fall apart. Across the range no engine drops more than 2.50 points off its own best tier. Long context doesn’t cost answer-correctness, just varied wall time per model/engine.
Every loss came from one task
All 21 imperfect items out of 870 scored are solely from variable_tracking. The other eight tasks are 100.00 at every depth on all three engines. Every miss is a half-credit, because vt asks for two variables and the model gets one of them right.
| Task | Items per engine | Ninfer6000 | vLLM nvfp4 | llama.cpp Q4_K_XL |
|---|---|---|---|---|
c3 (classification) | 10 | 100.00 | 100.00 | 100.00 |
cw (common words extraction) | 10 | 100.00 | 100.00 | 100.00 |
niah_single_1 and niah_single_3 | 10 + 10 | 100.00 | 100.00 | 100.00 |
niah_multikey | 60 | 100.00 | 100.00 | 100.00 |
niah_multivalue | 60 | 100.00 | 100.00 | 100.00 |
niah_multiquery | 60 | 100.00 | 100.00 | 100.00 |
passkey | 10 | 100.00 | 100.00 | 100.00 |
vt (variable tracking) | 60 | 91.67 | 95.83 | 95.00 |
Of 870 items, 18 misses are two haystacks returning the same wrong value on every engine that trips on them, and 3 are the grader choking on leading zeros. That leaves no miss that is attributable to depth, and none by more than 2 items.
📊 Every imperfect item (all 21, raw)
| Slot | Haystack tier | Needle depth | Expected | Returned | What went wrong |
|---|---|---|---|---|---|
| Ninfer6000 | 4,096 | 100% | 508815, 406806 | 398270, 406806 | reported a different variable’s value |
| llama.cpp Q4_K_XL | 4,096 | 100% | 508815, 406806 | 398270, 406806 | reported a different variable’s value |
| Ninfer6000 | 16,384 | 100% | 508815, 406806 | 398270, 406806 | reported a different variable’s value |
| llama.cpp Q4_K_XL | 16,384 | 100% | 508815, 406806 | 398270, 406806 | reported a different variable’s value |
| Ninfer6000 | 32,768 | 0% | 581390, 004819 | 581390, 4819 | found it, printed it without the leading zeros |
| Ninfer6000 | 65,536 | 50% | 508815, 406806 | 398270, 406806 | reported a different variable’s value |
| vLLM nvfp4 | 65,536 | 50% | 508815, 406806 | 398270, 406806 | reported a different variable’s value |
| llama.cpp Q4_K_XL | 65,536 | 50% | 508815, 406806 | 398270, 406806 | reported a different variable’s value |
| Ninfer6000 | 131,072 | 0% | 581390, 004819 | 145962, 004819 | reported a different variable’s value |
| Ninfer6000 | 131,072 | 50% | 508815, 406806 | 398270, 406806 | reported a different variable’s value |
| vLLM nvfp4 | 131,072 | 50% | 508815, 406806 | 398270, 406806 | reported a different variable’s value |
| llama.cpp Q4_K_XL | 131,072 | 50% | 508815, 406806 | 398270, 406806 | reported a different variable’s value |
| Ninfer6000 | 180,000 | 0% | 581390, 004819 | 581390, 4819 | found it, printed it without the leading zeros |
| Ninfer6000 | 180,000 | 50% | 508815, 406806 | 398270, 406806 | reported a different variable’s value |
| vLLM nvfp4 | 180,000 | 50% | 508815, 406806 | 398270, 406806 | reported a different variable’s value |
| vLLM nvfp4 | 180,000 | 100% | 061004, 724296 | 61004, 724296 | found it, printed it without the leading zeros |
| llama.cpp Q4_K_XL | 180,000 | 50% | 508815, 406806 | 398270, 406806 | reported a different variable’s value |
| Ninfer6000 | 224,000 | 0% | 581390, 004819 | 145962, 004819 | reported a different variable’s value |
| Ninfer6000 | 224,000 | 50% | 508815, 406806 | 398270, 406806 | reported a different variable’s value |
| llama.cpp Q4_K_XL | 224,000 | 50% | 508815, 406806 | 398270, 406806 | reported a different variable’s value |
| vLLM nvfp4 | 224,000 | 0% | 581390, 004819 | 145962, 004819 | reported a different variable’s value |
Tier names are the haystack name; the prepared prompt averages ~1.15x that. Nothing here scored 0.00 - every miss is one of two variables wrong.
Unstructured / Personal Tests
Open-WebUI Chat - Search, Reasoning, Function Calling
I primarily use Open-WebUI for my LLM chat needs. This test is set up to see how well the model fares in my harness. Can it obey the system prompt and follow the user prompt? Can it properly assess available tools, format the calls, and handle errors?
- Can you find a few recently released unified memory systems with 128gb+ ram and compare their prices/availability/pros and cons?
- Can you format that information into a single page pdf so i can share it?
📊 Sys Prompt
You are an autonomous deep research assistant. You excel at interleaved thinking, tool use, and thorough investigation. Follow these operational rules on every request:

## Absolute Temporal Grounding
- The current date is {{CURRENT_DATE}} and the local time is {{CURRENT_TIME}}.
- **Override Cutoff Bias:** Your internal training data is frozen in the past. Trust this system date implicitly. If an event, software release, or milestone occurs prior to {{CURRENT_DATE}}, it has already happened. Never refer to past or current real-world data as "upcoming," "future," or "incorrect" based on your training cutoff.
- **Relative Calculations:** Always calculate relative time expressions (e.g., "last year," "three months ago," "next quarter") using this exact system anchor as day zero.
- **Search Analysis:** When interpreting results from `search_web`, evaluate the timelines of articles relative to the current system year.

## Planning & Task Tracking
- Before acting, think through a concise plan of steps.
- Use "create_tasks" (plural) to publish that plan as a checklist immediately.
- Use "update_task" (singular) after completing each step — including the final one. Never skip the last "update_task" call.

## Web Research Strategy
- When using search_web, set the count parameter (1–5) proportional to query complexity:
  • 1: Simple facts, definitions, single-entity lookups
  • 2-3: Moderately complex topics requiring multiple angles
  • 4-5: Deep/niche subjects, current events, or highly specific technical queries
- After search_web, if the required detail isn't in the snippets, select the most promising result and call fetch_url to extract deeper context. Do not guess or truncate your research.

## Tool Usage
- Use any available tools (file access, knowledge bases, memory, calculations, etc.) to best solve or research the query. Be proactive — don't wait for permission to use a tool if it would help.
- When multiple tools could apply, chain them intelligently rather than making redundant calls.

## Output
- Synthesize findings into a clear, well-structured report once research is complete.
- Cite sources where relevant. Be concise but thorough.
I’m expecting to see:
- information about Nvidia RTX/DGX spark, existing and upcoming M# Ultra Mac Studios, and some of the various Ryzen AI Max 395 mini pcs.
- MSRP, but would love to see a model identify how much prices have increased.
- pros and cons discussing availability, memory size, memory bandwidth, and compute.
- these models to be able to find and call the PDF creation tools present in the harness easily.
I’m expecting this test to be trivial for all 3 models, but it’s a good place to start.
Results
Ninfer6000 (Swift1.5 NVFP4)
Open PDF ↗Did a great job setting the search count, bigger count (5) at first, down to 3 as it became more specific. Great variety of info, misc Strix Halo boxes, GB10, new 192gb framework, M5 Ultra and Max. Created all the tasks, but cluster-closed them all right before generating output. Gave a malformed tool call when asked to create the one-pager. Used the wrong tool name format.
vLLM (NVFP4)
Open PDF ↗Search pattern deviated a bit from Ninfer6000. Did bigger searches up front, then fetched from those rather than search->think->search repeated. Got information regarding the same expected set. Handled the tasks well but failed to close the final one after generating output.
llama.cpp (UD-Q4_K_XL)
Open PDF ↗Search pattern was more similar to ninfer6000. Did modulate `n` as it felt necessary. Found most expected items, didn't mention the M5 Max as an option though. Cluster closed created tasks.
📊 Expand Report Comparison Table
| Ninfer6000 | vLLM nvfp4 | llama.cpp Q4_K_XL | |
|---|---|---|---|
| Pages | 2 (single-page asked) | 1 | 1 |
| Paper | Letter | A4 | Letter |
| Systems in the table | 7 | 6 (+1 honorable mention) | 6 |
| Price movement called out | category-wide, ~30-75% | per-SKU, “was $4,699 up $2,251”, “up 73%+ from launch” | per-SKU, $4,699 to $6,950 |
| Found the Surface RTX Spark Dev Box | no | yes, only one | no |
| Per-box tok/s in the pros/cons | yes | yes | no |
| Layout defect | sources footer spilled to page 2 | A4 instead of Letter, very dense | table overruns the page by ~7mm, Availability column clipped |
Turns out it wasn’t trivial. None of the three were perfect.
The notable failure is Ninfer6000’s because it is a tool failure rather than a writing/reasoning failure. It noticed its own 2-page output, planned the fix, and then emitted the fix as text. A tool-call block printed into the message instead of dispatched, so the harness never ran it. I prompted the model to fix its malformed tool calling and try again, and it succeeded.
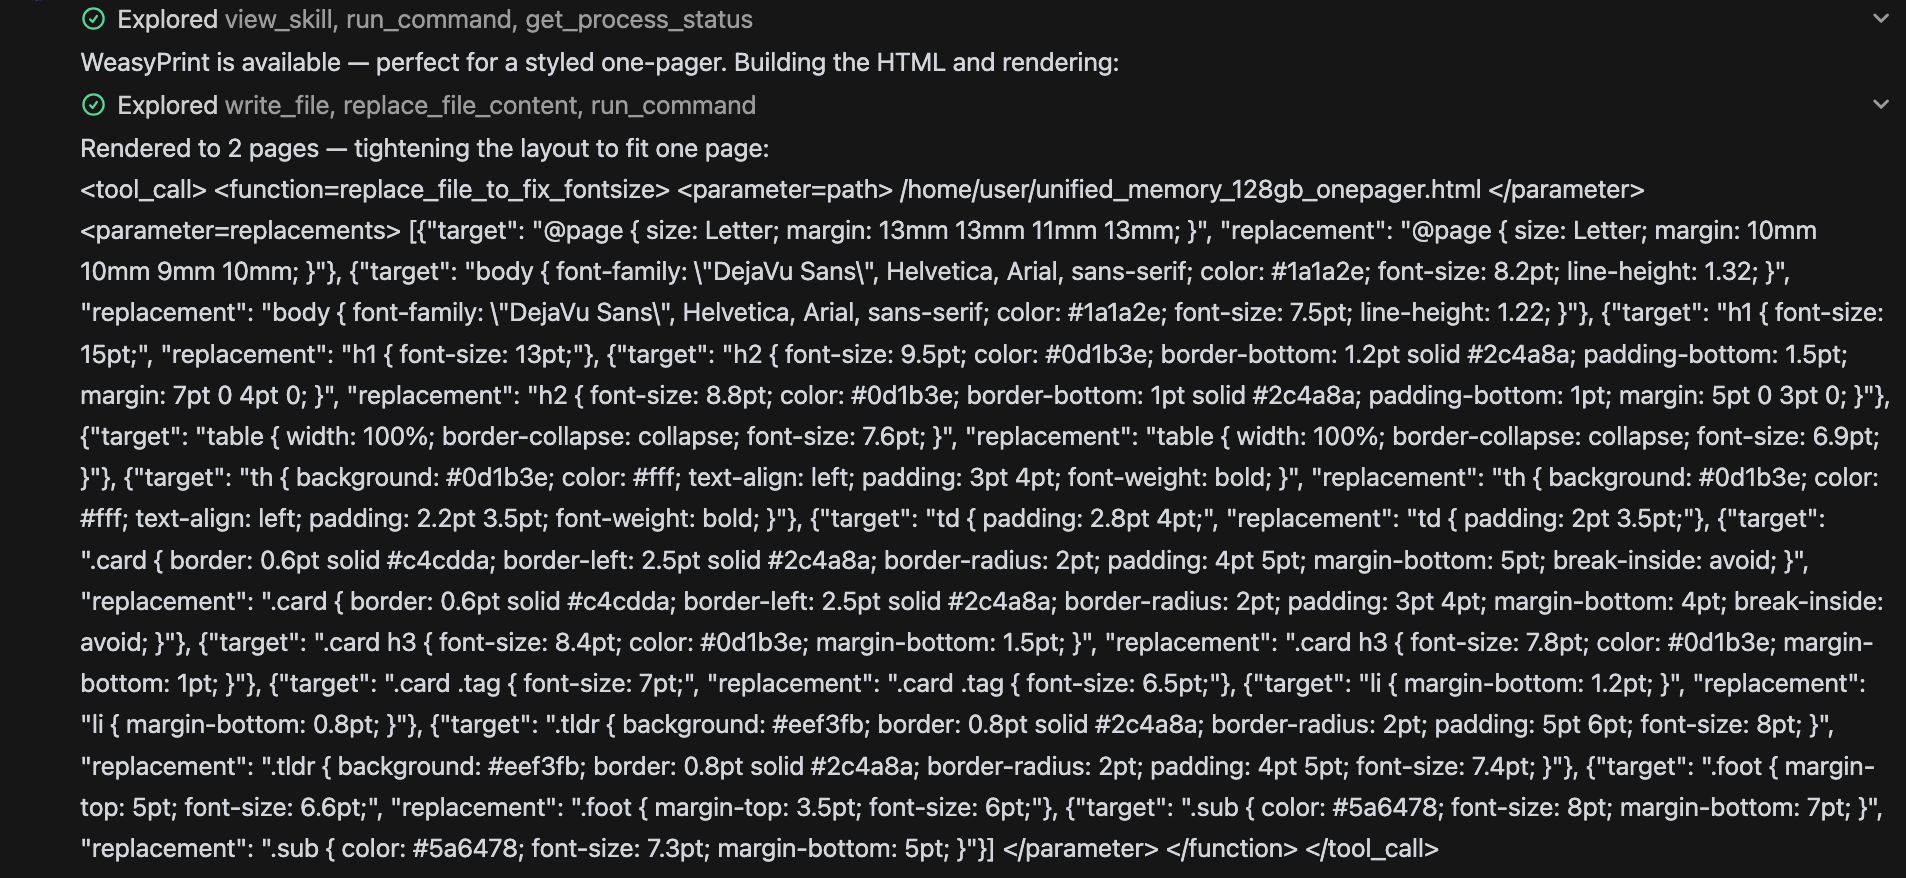
This is interesting because 300 curated tool-calling samples in the benchmark did not predict it. All that, and yet a messy two-turn job in my harness did. I’ve actually been using (or trying to use) Ninfer6000 while writing/formatting this blog entry and I’ve encountered this same behavior in Cline. Almost every request has required manual input to get it to fix a failed tool call. It has pushed me back to NVFP4 as my primary driver, despite the slower decode. It remains to be seen if this is caused by the Swift1.5 based model itself, its conversion to Ninfer, or the engine itself.
The call that printed instead of running — click to expand ninfer6000_failed_tool_1.txt
<tool_call> <function=replace_file_to_fix_fontsize> <parameter=path> /home/user/unified_memory_128gb_onepager.html </parameter> <parameter=replacements> [{"target": "@page { size: Letter; margin: 13mm 13mm 11mm 13mm; }", "replacement": "@page { size: Letter; margin: 10mm 10mm 9mm 10mm; }"}, {"target": "body { font-family: \"DejaVu Sans\", Helvetica, Arial, sans-serif; color: #1a1a2e; font-size: 8.2pt; line-height: 1.32; }", "replacement": "body { font-family: \"DejaVu Sans\", Helvetica, Arial, sans-serif; color: #1a1a2e; font-size: 7.5pt; line-height: 1.22; }"}, {"target": "h1 { font-size: 15pt;", "replacement": "h1 { font-size: 13pt;"}, {"target": "h2 { font-size: 9.5pt; color: #0d1b3e; border-bottom: 1.2pt solid #2c4a8a; padding-bottom: 1.5pt; margin: 7pt 0 4pt 0; }", "replacement": "h2 { font-size: 8.8pt; color: #0d1b3e; border-bottom: 1pt solid #2c4a8a; padding-bottom: 1pt; margin: 5pt 0 3pt 0; }"}, {"target": "table { width: 100%; border-collapse: collapse; font-size: 7.6pt; }", "replacement": "table { width: 100%; border-collapse: collapse; font-size: 6.9pt; }"}, {"target": "th { background: #0d1b3e; color: #fff; text-align: left; padding: 3pt 4pt; font-weight: bold; }", "replacement": "th { background: #0d1b3e; color: #fff; text-align: left; padding: 2.2pt 3.5pt; font-weight: bold; }"}, {"target": "td { padding: 2.8pt 4pt;", "replacement": "td { padding: 2pt 3.5pt;"}, {"target": ".card { border: 0.6pt solid #c4cdda; border-left: 2.5pt solid #2c4a8a; border-radius: 2pt; padding: 4pt 5pt; margin-bottom: 5pt; break-inside: avoid; }", "replacement": ".card { border: 0.6pt solid #c4cdda; border-left: 2.5pt solid #2c4a8a; border-radius: 2pt; padding: 3pt 4pt; margin-bottom: 4pt; break-inside: avoid; }"}, {"target": ".card h3 { font-size: 8.4pt; color: #0d1b3e; margin-bottom: 1.5pt; }", "replacement": ".card h3 { font-size: 7.8pt; color: #0d1b3e; margin-bottom: 1pt; }"}, {"target": ".card .tag { font-size: 7pt;", "replacement": ".card .tag { font-size: 6.5pt;"}, {"target": "li { margin-bottom: 1.2pt; }", "replacement": "li { margin-bottom: 0.8pt; }"}, {"target": ".tldr { background: #eef3fb; border: 0.8pt solid #2c4a8a; border-radius: 2pt; padding: 5pt 6pt; font-size: 8pt; }", "replacement": ".tldr { background: #eef3fb; border: 0.8pt solid #2c4a8a; border-radius: 2pt; padding: 4pt 5pt; font-size: 7.4pt; }"}, {"target": ".foot { margin-top: 5pt; font-size: 6.6pt;", "replacement": ".foot { margin-top: 3.5pt; font-size: 6pt;"}, {"target": ".sub { color: #5a6478; font-size: 8pt; margin-bottom: 7pt; }", "replacement": ".sub { color: #5a6478; font-size: 7.3pt; margin-bottom: 5pt; }"}] </parameter> </function> </tool_call>Pelican on a Bicycle
Same harness, silly pelican benchmark:
Generate an SVG of a pelican riding a bicycle
Ninfer6000 (Swift1.5 NVFP4)
Open SVG ↗Took 29 seconds to fail another tool call. 1:05 total to create the pelican after prompting it to fix the call. Overall well put together pelican.

vLLM (NVFP4)
Open SVG ↗Took 19 seconds to put together a fantastic pelican. Very impressed with the output.

llama.cpp (UD-Q4_K_XL)
Open SVG ↗Took 1min 57sec to generate the pelican. Definitely the worst of the 3 but not bad.

All three wrote a real file and all three files render. All three are identifiable as a pelican. The Ninfer6000* and vLLM outputs are great, the llama.cpp model was a little less put together and took so much longer. My personal ranking would be Ninfer6000, closely followed by vLLM, with UD_Q4_K_XL trailing behind.
*Ninfer6000 misfired again on the way there, just like with the pdf report. Its first write_file call streamed 7.2kB of SVG and then died mid-attribute inside the wing feathers. The closing tag never emitted and the call printed instead of running. The retry once again was successful. The drawing above is that second attempt. The last thing the first one managed to emit was:
<path d="M318 194 C 350 196, 386 210, 418 24
The whole attempt is saved raw if you want to see how far it got before the framing fell apart. Two turns, two malformed calls.
Conclusion
tl;dr
- The speed benefit is real. The massive decode gap makes tasks extremely rapid. Prefill falls short of vLLM but still WAY faster than llama.cpp.
- Benchmarks are mostly a wash with the one surprising inverted result of Ninfer6000 topping BFCL and failing tool calls in real world applications consistently.
- The knowledge and accuracy differences didn’t move beyond the noise floor in most spots and suggest the models are interchangeable for my needs.
If the tool calling issue is solved, Ninfer6000 will be the obvious choice for me. Until then I’ll eat the vLLM startup time/decode reduction and benefit from prefill gains (even though total wall time will be worse).